Overview
This section covers the two different tree views and how they are presented in Apollo.
Tree View
The tree view contains the system objects grouped into the Pool, Region, Links, Groups and Storages.
note
The tree view changes from Scenario Tree View to Object Tree View when a scenario has been loaded.
Scroll through the image gallery to see the two tree views.
 Object Tree View
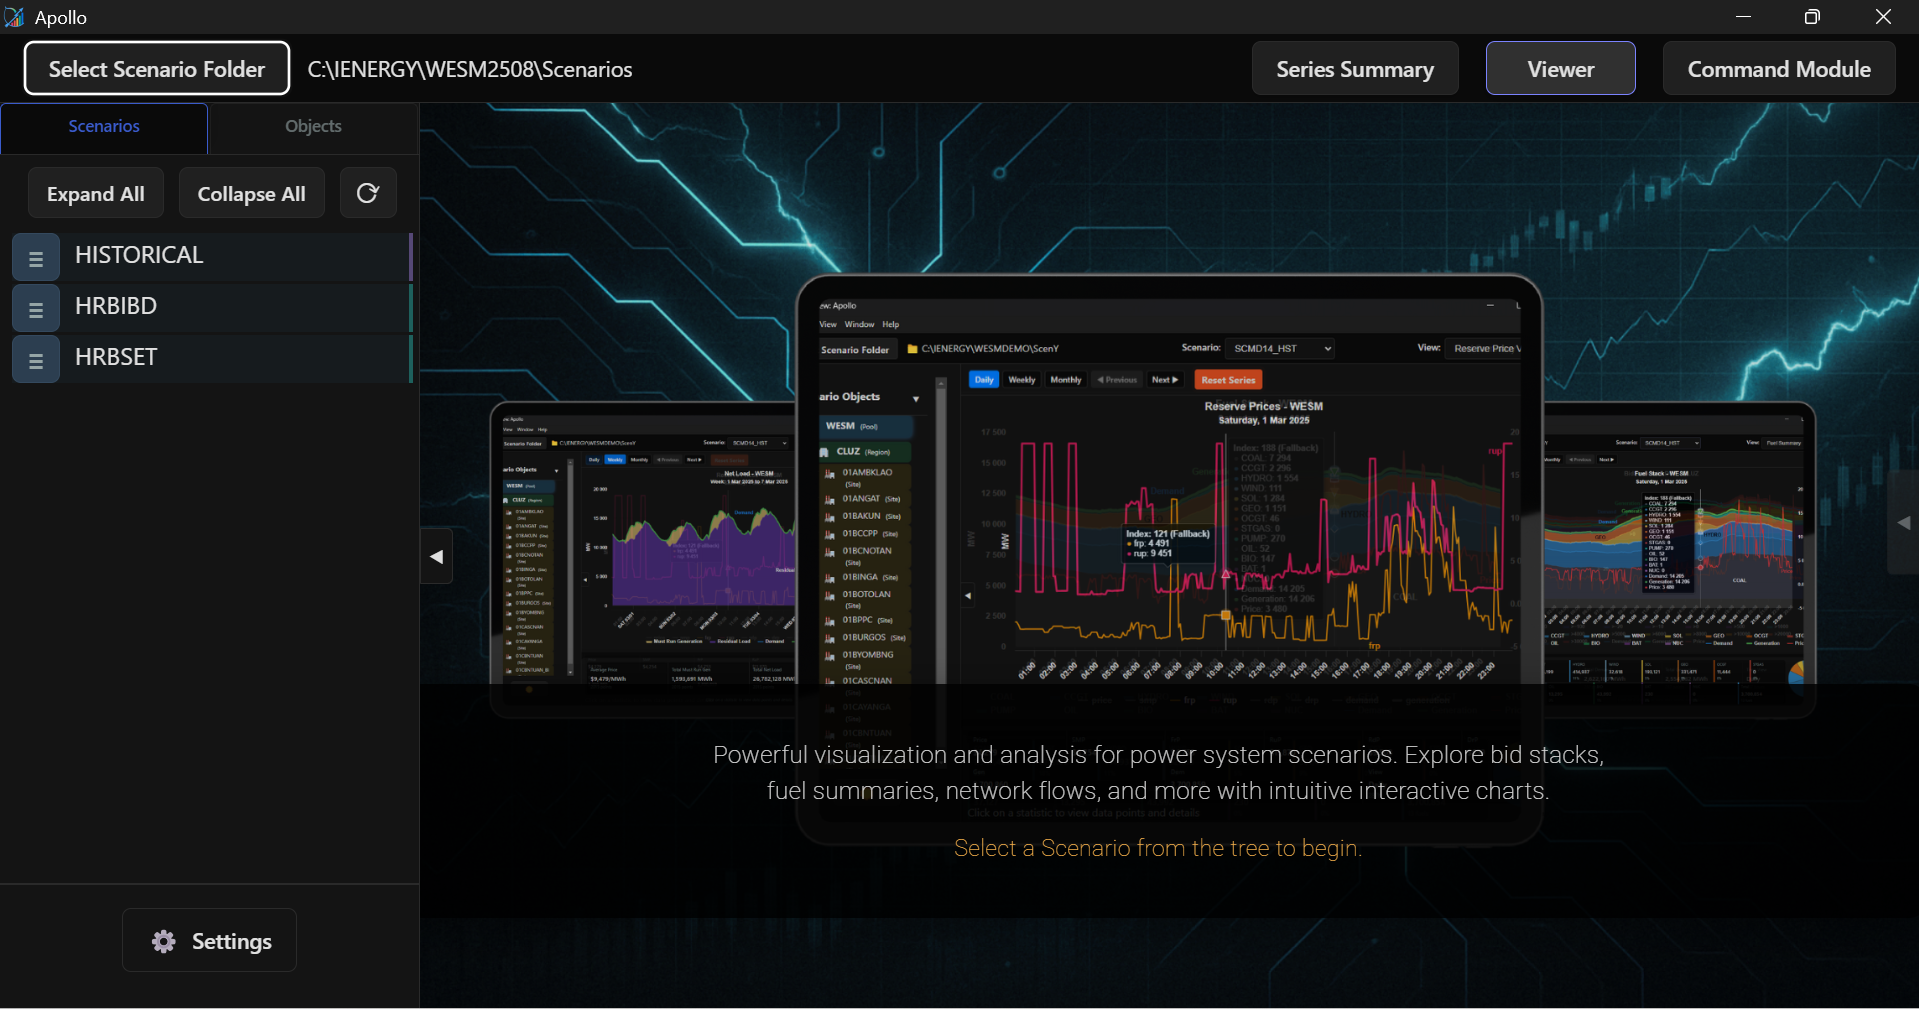 Scenario Tree View
- Object Tree View
- Scenario Tree View
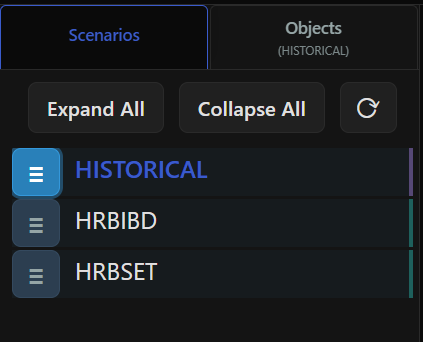
Scenario Tree View
The Scenario Tree View lists all processed scenarios. Scenarios are categorized by their data source, identified by color-coded tags:
- Historical Load: Identified by a Purple Tag.
- Simulation: Identified by a Green Tag.
 Historical LoadSimulation
- Historical LoadSimulation
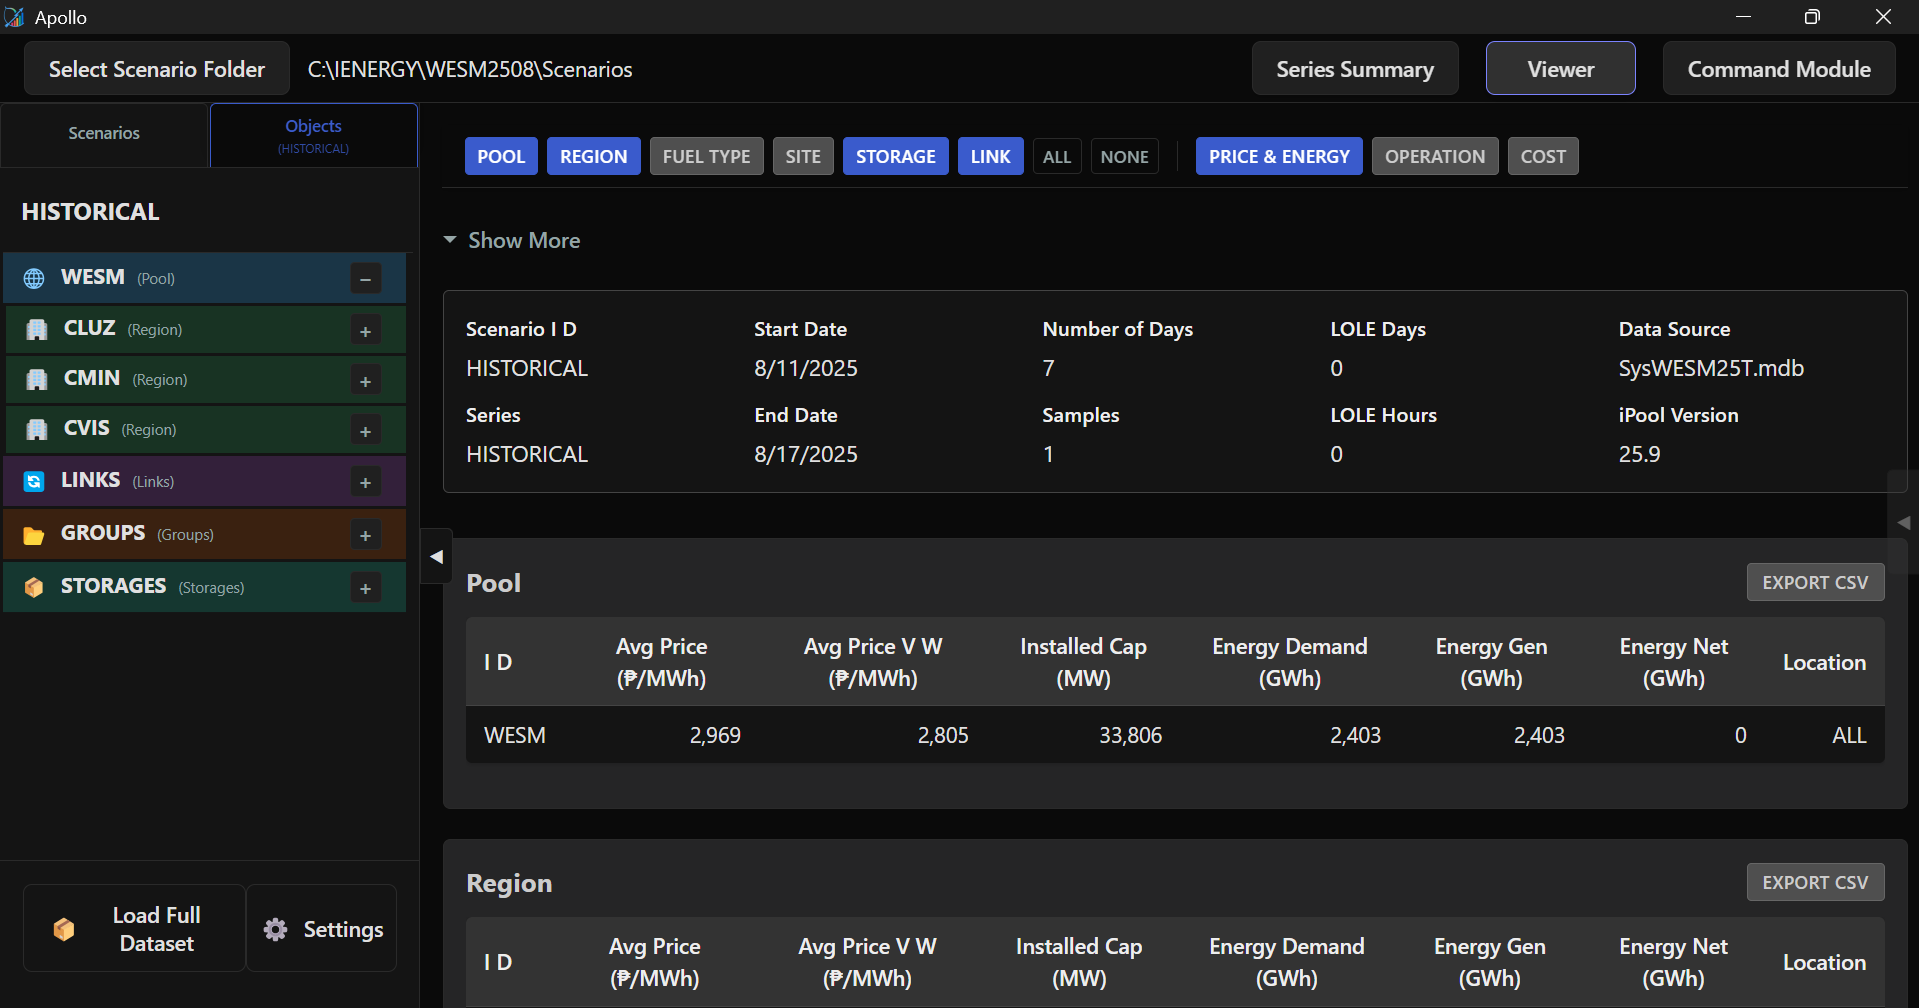
Object Tree View
Once a scenario is active, the tree displays system objects available for analysis. Click any object to view its specific data tables.
Hierarchy Structure
- Pool (WESM): The top-level market aggregate.
- Regions (CLUZ, CVIS, CMIN): Regional subsection each containing specific Sites and individual Units.
- Links: Interconnectors managing flow between regions (e.g., MinVis, LuzVis).
- Groups (Fuel Types): Assets categorized by technology (e.g., Solar, Coal, Battery, Geothermal).
- Storages: Dedicated view for BESS and Pumped Hydro assets.